Reports
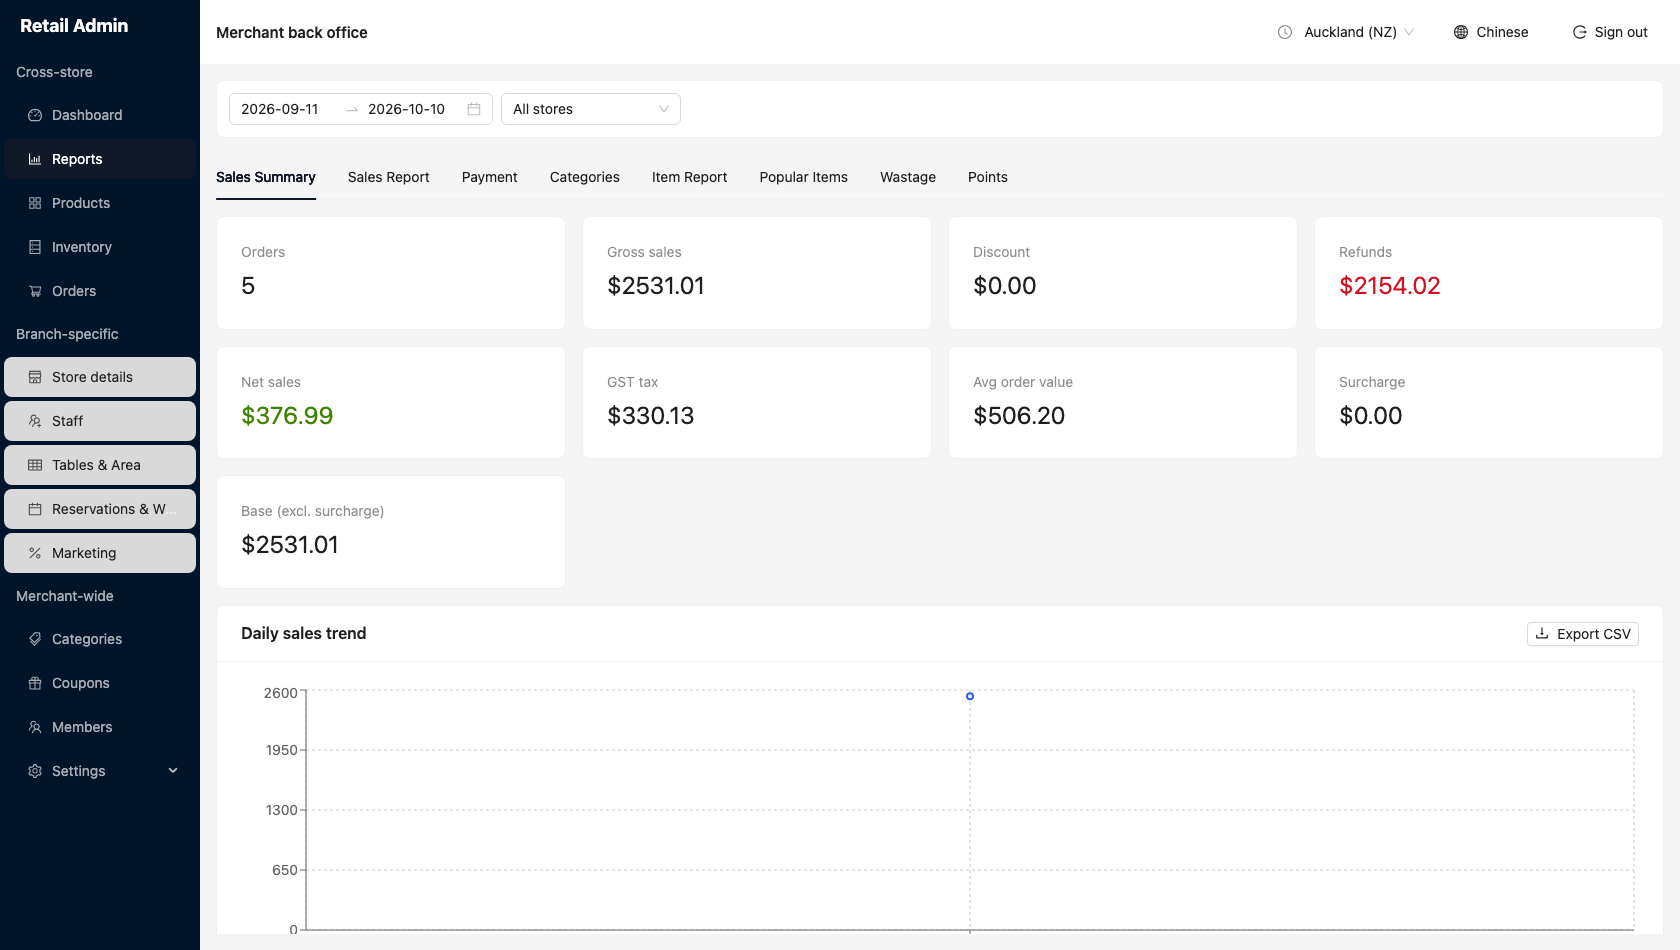
Eight views over the same period, each exportable. Set the period and the store once at the top; every tab follows it.
Set the period
- Click Reports, then click the date range at the top left.
- Pick a preset down the left of the calendar — Today, Last 7 days, Last 30 days, This month, Last month — or click a start and an end day for your own range.
- Use the store dropdown beside it to stay on All stores or focus one branch.
The other tabs
| Tab | What it answers |
|---|---|
| Sales Report | Every order in the period, line by line: order number, time, store, channel, cashier, member, discount, GST, total, status and payment method. |
| Payment | Money by method and acquiring channel — count, received, refunded, net and share of takings. |
| Categories | Quantity, revenue, share and margin per category. |
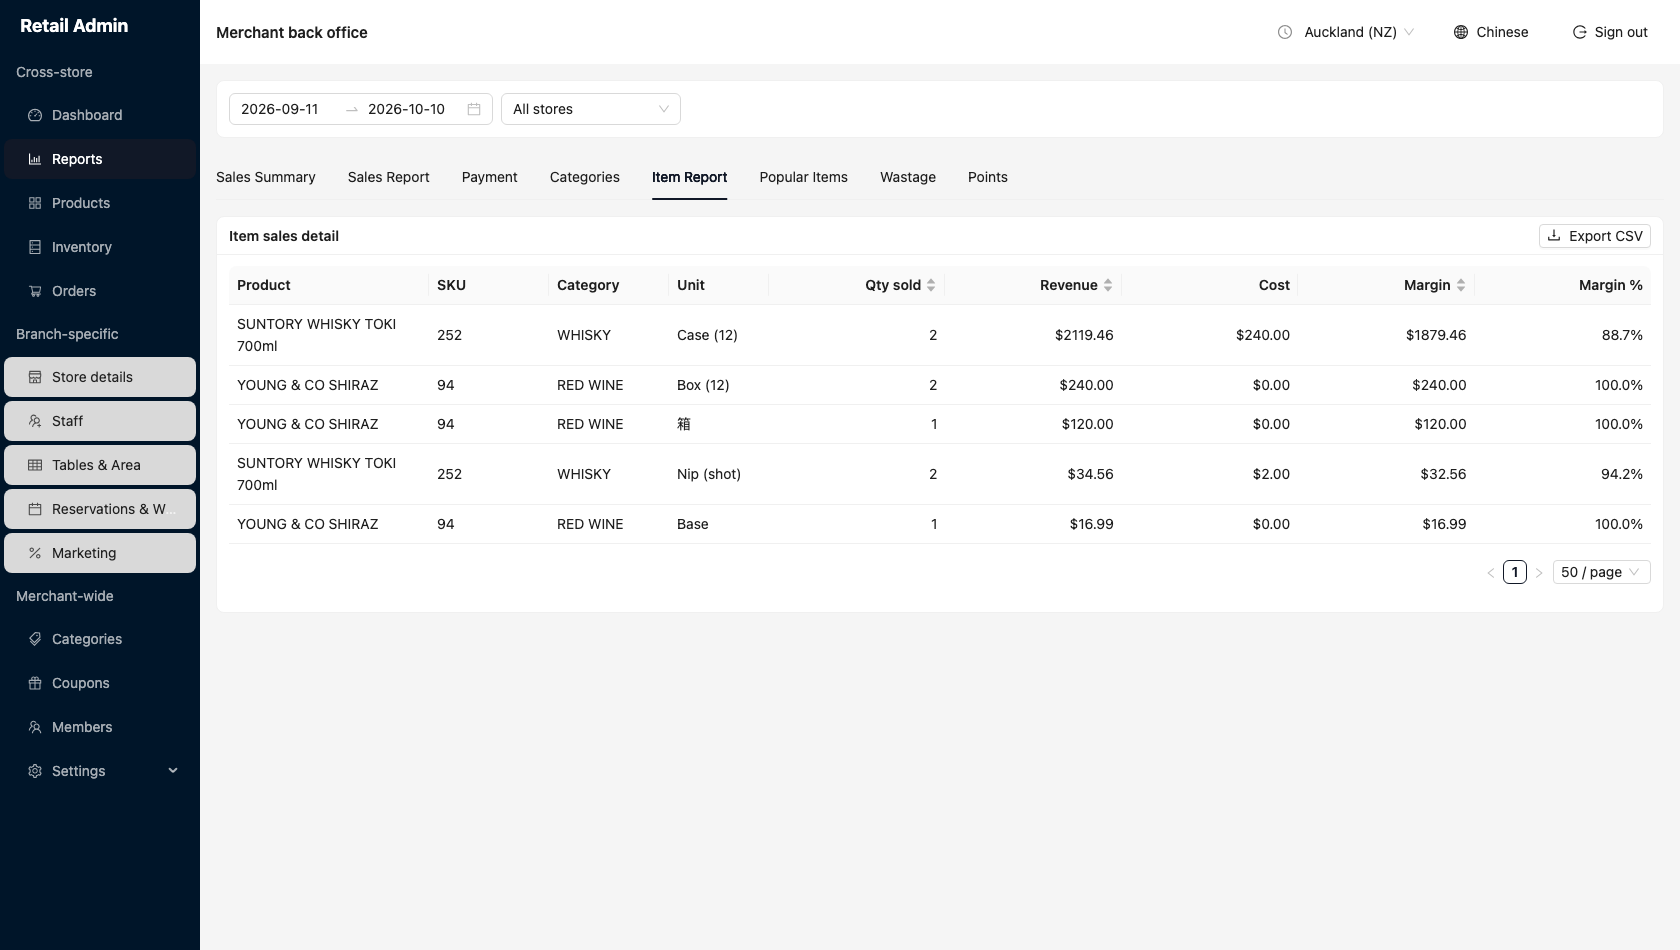
| Item Report | Sales detail broken out by unit: product, SKU, category, the unit sold (Base, Case, Nip…), quantity, revenue, cost, margin and margin %. |
| Popular Items | Your top twenty products (unit sizes totalled together), switchable between By revenue and By qty. |
| Wastage | Total waste value and quantity, then every write-off with its product, quantity, unit cost, operator and reason. |
| Points | Loyalty points earned and redeemed in the period, per member and in total. |
Export
- Click Export CSV on the card you want. Several tabs have one button per table.
- A CSV named after that report downloads through your browser — for example the summary trend saves as
sales-summary-daily.csv. - The file contains the rows for the period and store currently selected, so set those before you export.